RTP Flow Monitor
I thought I made a post about this a while ago, but it turns out I never got back around to it :-). While I have a lot of issues with Cisco at the moment about various hardware platforms and issues, the one platform that hasn’t burned me yet is the Nexus 9k series with all of its different features. One nice feature I use occasionally is the RTP Flow Monitor function that exists on the FX2 chipset. I guess if I had any complaints about the Nexus 9K line its that some hardware supports this and some hardware does not.
The RTP flow monitor basically uses Netflow and samples every packet for RTP so you can see your multicast statistics for your video. If you only use UDP and not RTP you will see errors on the flow even if there are no errors because it is looking for RTP sequence numbers, so make sure you understand what it is you are actually monitoring.
The configuration is fairly simple but it requires a reboot after you have completed it. Here is the configuration I wind up using.
feature netflow
ip flow rtp

ip access-list nfm-rtp-ipv4-acl
ignore routable
10 permit ip any 232.0.0.0/8

hardware access-list tcam region egr-racl 1536
hardware access-list tcam region egr-l3-vlan-qos 256
One weird bug/thing I have noticed is that it tries to add a line in about udp ports to my access list after reboot so be careful of that. My specific configuration here with this access list is meant to catch any potential SSM multicast that we could use. Sometimes my access list is UDP port based, but I find doing it based on multicast ranges I’m looking for works better for me.
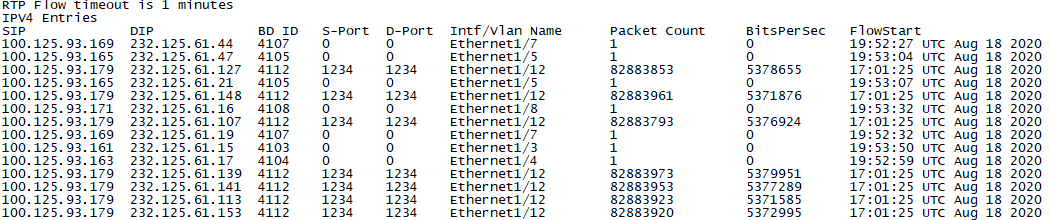
After you have applied the configuration and rebooted you can now issue the commands to see your flows
show flow rtp details
If you want to see what flows you have that have errors on them the command is –
show flow rtp errors active 
These errors above are being seen right now because they are UDP instead of RTP flows so it is not able to properly tell what is going on with these streams. There is also the show flow rtp errors history command that will look back over the period of about 24 hours to tell you if you have had an error that might have cleared up and no longer be active.
Also if you look at your logs on your switch you will now see the errors there. Unfortunate this could be filling up your log if they keep happening so hopefully your offloading those on a different system like splunk.
%NFM-1-RTP_FLOW_ERROR_DETECTED: Flow SIP: 100.125.93.161 DIP: 232.125.61.45 Interface: Ethernet1/3 loss detected