Nexus 9000 Queue drops
This particular post won’t have a resolution to the problem I’m currently experiencing but I want to illustrate the problem now and HOPEFULLY have another blog that actually has the resolution later if Cisco ever gives me a good one.
*UPDATE* – Cisco came up with a resolution which was some odd programming to how it used the NAT. When an SFP was not in the interface the NAT was using, it could only do up to 80 Gigs. Once we used an interface that had an SFP it corrected the problem.
We have a lab for our IPFM Spine/Leaf system where we have some uncompressed 1.3 Gig video streams passing through. In order to test throughput on our 100 Gig Next Gen backbone we connected our border leaf up to it to pull traffic through. Cisco with version 9.3.5 is introducing the Multicast NAT function where we can NAT 1 multicast to 40 different streams. I’ll have a future blog post about this is the near future. Cisco was nice enough to provide an EFT version of the software to us for testing which mostly works well, but we have experienced a few issues that we are trying to figure out.
Creating 40 streams of 1.3 gigs generated about 55 Gigs of traffic which wasn’t an issue. When we tried to generate another 30 or streams it stops when it gets to about 80 gigs and won’t get past it. After doing some troubleshooting with Cisco it turns out that its multicast Queue drops occurring. Hopefully this is not going to turn out to be a hardware issue. but we are still investigating. Here are some commands that show us the drop is happening.
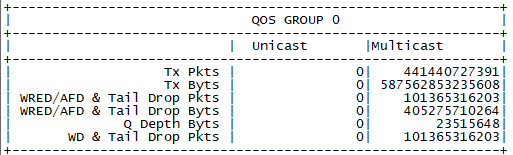
show queuing interface ethernet 1/53

The Tail Drops in this case are constantly increasing on this port that we have the 80 gigs of traffic on (which should be much more). On other ports that egress multicast traffic you will have TX Pkts and Byts, but your Tail Drop should be zero.
Another command that Cisco was using to troubleshoot that I honestly don’t fully understand but I will share anyway while I do more research on it involves attaching to the module to pull the info
attach module 1
show hardware internal buffer info pkt-stats
That produces the below output on the unhealthy box.

On a healthy box the output looks more like this. Again I’m not sure what the output here means yet, but the Cisco techs were very interested in the above.

More to come once I find out what the actual issue is that is causing the problem. I’m really hoping this is not a hardware limitation.